The best stats you've ever seen | Hans Rosling
TED・17 minutes read
The speaker discussed the importance of using contextualized data analysis to showcase global health and income disparities, emphasizing the need for accessible and searchable public data for students and entrepreneurs worldwide. The new head of UN statistics is optimistic about advancements in data analysis and the changing income distributions globally, underlining the importance of making data easily accessible and understandable through graphic formats for broader insights.
Insights
- Swedish students had less global knowledge than chimpanzees according to a pretest, revealing significant gaps in understanding, with Turkey showing the highest child mortality among five countries, indicating disparities in global health outcomes.
- The speaker's software visualized changes in family sizes and life expectancies worldwide since 1962, emphasizing the impact of family planning and economic shifts, while debunking the simplistic rich-poor gap narrative, stressing the importance of nuanced data analysis and making public data accessible for informed decision-making.
Get key ideas from YouTube videos. It’s free
Recent questions
How did the speaker use software to display global health data?
The speaker developed software that visually represented global health data using bubbles to denote countries based on population and fertility rate. This tool allowed for the visualization of changes in family sizes and life expectancies across countries since 1962, showcasing improvements in health outcomes in some regions.
What did the speaker compare between the US and Vietnam in 1964?
The speaker compared the US and Vietnam in 1964 to illustrate how family planning and economic changes influenced life expectancies and family sizes. This comparison highlighted the impact of different approaches to healthcare and economic development on the well-being of populations in these two countries.
What did the speaker emphasize about the distribution of global income?
The speaker debunked the myth of a simple rich-poor gap in global income distribution, showcasing a more nuanced picture. By highlighting variations within regions like Africa, South Asia, and Latin America, the speaker emphasized the importance of contextualized data analysis to understand the complexities of income distribution worldwide.
What was the focus of the Gapminder project discussed by the speaker?
The Gapminder project, discussed by the speaker, aimed to make public data more accessible and usable through software that linked databases and design tools. This initiative sought to empower users to explore and analyze data effectively, challenging the notion that detailed data analysis was unattainable.
Why did the speaker advocate for making publicly funded data accessible?
The speaker advocated for making publicly funded data accessible to students and entrepreneurs worldwide to ensure its searchability and usability through design tools. By emphasizing the importance of making detailed data searchable and available to the public, the speaker aimed to promote transparency and informed decision-making based on reliable data sources.
Related videos
BBC
Hans Rosling's 200 Countries, 200 Years, 4 Minutes - The Joy of Stats - BBC Four
TED-Ed
The best stats you've ever seen - Hans Rosling

CA Parag Gupta
Most Important Questions | Introduction to Statistics | Class 11 : STATISTICS (2023-24)

TEDx Talks
TEDxMidAtlantic 2011 - Duncan Watts - The Myth of Common Sense

TEDx Talks
Six Reasons Why Research is Cool: Quique Bassat at TEDxBarcelonaChange

Summary
00:00
"Global Development Data: Challenging Misconceptions"
- The speaker taught global development to Swedish undergraduate students after studying hunger in Africa for 20 years.
- A pretest revealed that Swedish students knew less about the world than chimpanzees, with Turkey having the highest child mortality among five countries.
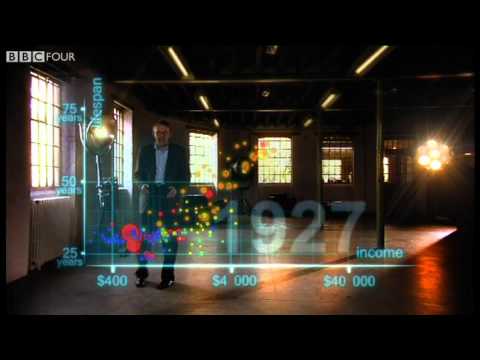
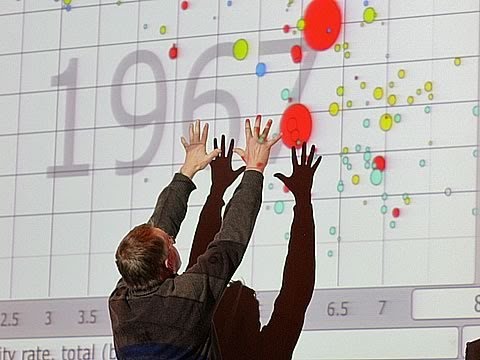
- The speaker developed software displaying global health data, with bubbles representing countries based on population and fertility rate.
- The software showed changes in countries' family sizes and life expectancies since 1962, with some countries improving health outcomes.
- A comparison between the US and Vietnam in 1964 showed how family planning and economic changes impacted life expectancies and family sizes.
- The speaker highlighted the distribution of global income, debunking the myth of a rich-poor gap and showing a more nuanced picture.
- The speaker emphasized the need for contextualized data analysis, showcasing variations within regions like Africa, South Asia, and Latin America.
- The speaker discussed the Gapminder project, aiming to make public data more accessible and usable through software linking databases and design tools.
- The speaker advocated for a search function to make detailed data searchable and available to the public, challenging the notion that it's impossible to achieve.
17:02
Global push for accessible, usable data analysis.
- Publicly funded data should be made accessible to students and entrepreneurs worldwide, with a focus on ensuring its searchability and usability through design tools.
- The new head of UN statistics is optimistic about advancements in data analysis, highlighting the changing income distributions globally, emphasizing the importance of making data easily accessible and understandable through graphic formats for broader insights.


