Short Run Phillips Curve
EconplusDal・2 minutes read
The Phillips curve explains the relationship between inflation and unemployment, showcasing trade-offs and impacts of aggregate demand shifts. Developed by Phillips in the late 1950s, the model highlights the inverse relationship between wages/unemployment and inflation, with further adaptations to reflect wage growth and stagflation.
Insights
- The Phillips curve, developed by economist Phillips, showcases the inverse relationship between inflation and unemployment, aiding in understanding economic dynamics like inflation types and equilibrium.
- Economists modified the original theory to include inflation rates instead of wage growth, emphasizing the impact of wage changes on inflation and demonstrating the trade-offs between unemployment and inflation levels in the short run.
Get key ideas from YouTube videos. It’s free
Recent questions
What is the Phillips curve and its significance?
The Phillips curve, developed by economist Phillips in the late 1950s, illustrates the inverse relationship between inflation and unemployment. It helps in understanding inflation types, demand-pull, cost-push inflation, and the classical model's long-term equilibrium. The curve highlights the trade-off between low unemployment and high inflation or low inflation and high unemployment, aiding in substantiating economic arguments and essays.
How do aggregate demand shifts affect the Phillips curve?
Aggregate demand shifts impact the Phillips curve by influencing inflation and unemployment levels. Right shifts in aggregate demand lead to higher inflation and lower unemployment, while left shifts result in higher unemployment but lower inflation. This showcases the dynamic relationship between economic factors and how they affect the trade-off between inflation and unemployment as depicted by the Phillips curve.
Who furthered the Phillips curve model and how?
Economists furthered the Phillips curve model by replacing wage growth with the inflation rate. This modification reflected the direct impact of wage changes on inflation levels, providing a more accurate representation of the relationship between inflation and unemployment. By incorporating inflation rate, the model became more robust in explaining the dynamics of the economy and the trade-offs between inflation and unemployment.
What adaptation did monetarists make to the Phillips curve model?
Monetarists adapted the Phillips curve model to account for stagflation, a phenomenon where high inflation and high unemployment coexist. They recognized that negative supply-side shocks could lead to stagflation, challenging the traditional understanding of the Phillips curve's trade-off between inflation and unemployment. This adaptation allowed for a more comprehensive analysis of economic conditions and the factors influencing inflation and unemployment levels.
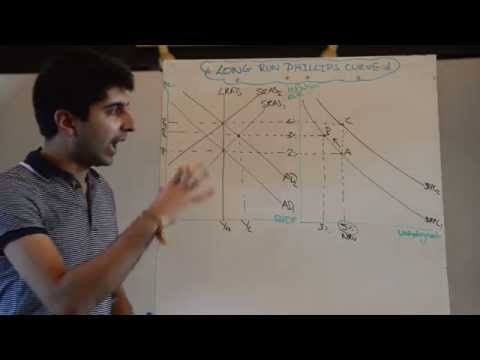
Why did economists develop the long-run Phillips curve?
Economists developed the long-run Phillips curve to address the model's lack of insights into long-term equilibrium. The original short-run Phillips curve focused on the trade-off between inflation and unemployment in the short term. However, to understand the economy's long-term dynamics and equilibrium, monetarists developed the long-run Phillips curve. This adaptation provided a more comprehensive framework for analyzing economic conditions and policy implications beyond short-term fluctuations.
Related videos

MIT OpenCourseWare
Lecture 9: The Phillips Curve and Inflation
EconplusDal
Long Run Phillips Curve

MIT OpenCourseWare
Lecture 8: The Labor Market

MIT OpenCourseWare
Lecture 1: Introduction to 14.02 Principles of Macroeconomics

EconplusDal
Y1 21) Types and Causes of Unemployment (Cyclical, Structural, Frictional and more)


Summary
00:00
Understanding the Phillips Curve and Inflation Trade-offs
- The Phillips curve, specifically the short-run Phillips curve, is useful for understanding inflation, demand-pull, cost-push inflation, and long-term equilibrium using the classical model.
- The curve highlights the conflict between inflation and unemployment, providing a tool to substantiate points in essays.
- Phillips, a New Zealand Economist, developed the theory in the late 1950s, correlating wages and unemployment to show an inverse relationship.
- Economists furthered the model by replacing wage growth with inflation rate, reflecting the direct impact of wage changes on inflation.
- The short-run Phillips curve demonstrates the trade-off between low unemployment and high inflation or low inflation and high unemployment.
- Aggregate demand shifts impact the Phillips curve, with right shifts leading to higher inflation and lower unemployment, and left shifts resulting in higher unemployment but lower inflation.
- Monetarists adapted the model to account for stagflation, where high inflation and high unemployment coexist due to negative supply-side shocks.
- The short-run Phillips curve shifts opposite to the direction of the supply curve, showcasing stagflation and cost-push inflation.
- The model lacks long-term equilibrium insights, prompting further adaptations by monetarists to develop the long-run Phillips curve.


