The Demand Curve
Marginal Revolution University・2 minutes read
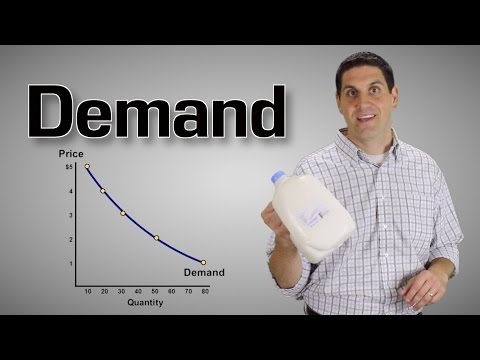
Demand curves in economics show the relationship between price and quantity demanded, seen in events like Black Friday. The demand curve for oil demonstrates how price changes affect consumer behavior based on the value and substitutability of products like jet fuel.
Insights
- Demand curves in economics show how changes in price affect the quantity of a good consumers want, as seen during events like Black Friday when lower prices drive higher sales.
- The demand curve for oil demonstrates how price shifts influence consumer demand, especially for high-value uses like jet fuel that are less easily replaceable, prompting buyers to adjust their purchases based on price changes to optimize costs and benefits.
Get key ideas from YouTube videos. It’s free
Recent questions
What do demand curves in economics show?
They illustrate how quantity demanded changes with price.
How do lower prices affect purchases during events like Black Friday?
Lower prices lead to increased purchases.
What does the demand curve for oil exemplify?
It shows how price fluctuations impact quantity demanded.
Why do consumers adjust purchases based on price changes?
To balance costs and benefits.
What is an example of a high-value use of oil?
Jet fuel, which is less substitutable.
Related videos

Federal Reserve Bank of St. Louis
Demand - Economic Lowdown

Yasser Khan..
Theory Of Demand | Demand | Microeconomics | Economics | Demand Analysis | Consumer Theory

Marginal Revolution University
The Supply Curve
Jacob Clifford
Demand and Supply Explained- Macro Topic 1.4 (Micro Topic 2.1)

Marginal Revolution University
Introduction to Consumer Choice


Summary
00:00
Impact of Price on Demand Curves
- Demand curves in economics illustrate how the quantity of a good demanded changes with price variations, such as during events like Black Friday where lower prices lead to increased purchases across various products.
- The demand curve for oil exemplifies how price fluctuations impact the quantity demanded, with high-value uses like jet fuel being less substitutable, leading to consumers adjusting their purchases based on price changes to balance costs and benefits.


